Infographics
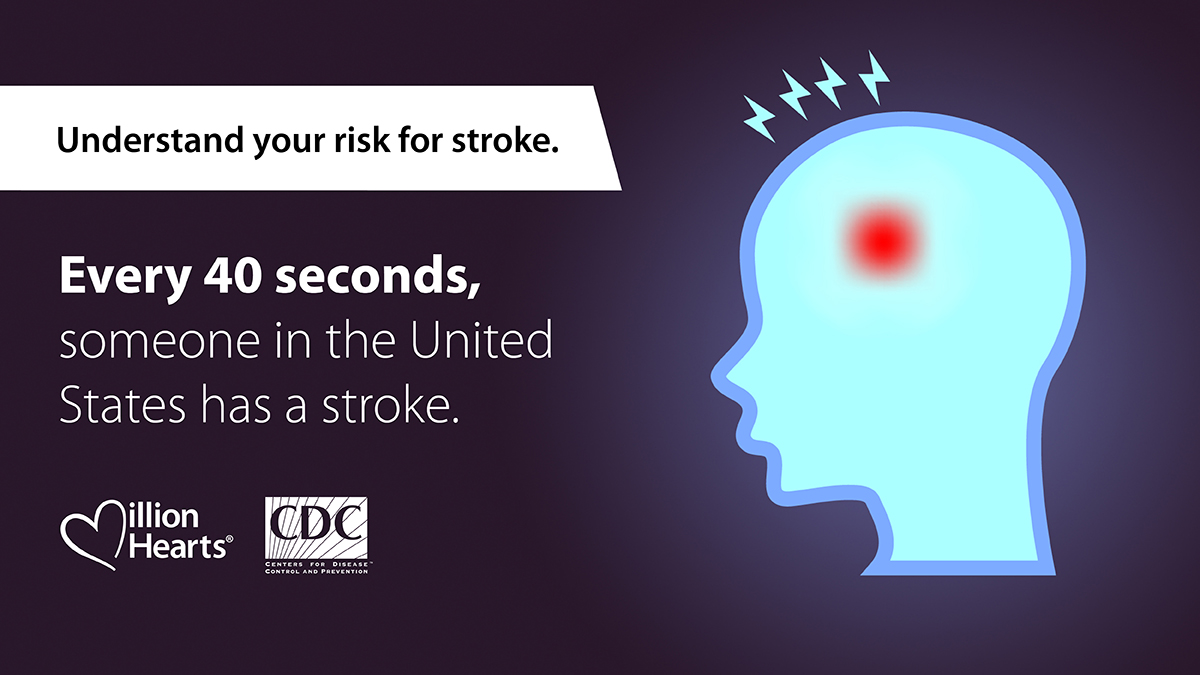
Understand Your Risk for Stroke
![Stroke infocard](https://www.cdc.gov/stroke/images/Stroke-Infocard1.jpg)
Find more graphics to share in the Centers for Disease Control and Prevention (CDC) Stroke Communications Kit.
Sodium Reduction
![Square_sodium-infographic Sodium: Tracking down the salt in food with Professor Saul T. About 90 percent of Americans eat more sodium than is recommended for a healthy diet.](/images/Square_sodium-infographic.png)
Find more sodium infographics on the CDC website.
Blood Pressure Control
![In a classroom of 30 youths, 1 has hypertension, and 3 more have elevated blood pressure.](https://www.cdc.gov/bloodpressure/images/BP-Youths.jpg)
Find more blood pressure graphics in CDC’s Blood Pressure Communications Kit.
Page last reviewed: November 8, 2019
Content source: Division for Heart Disease and Stroke Prevention